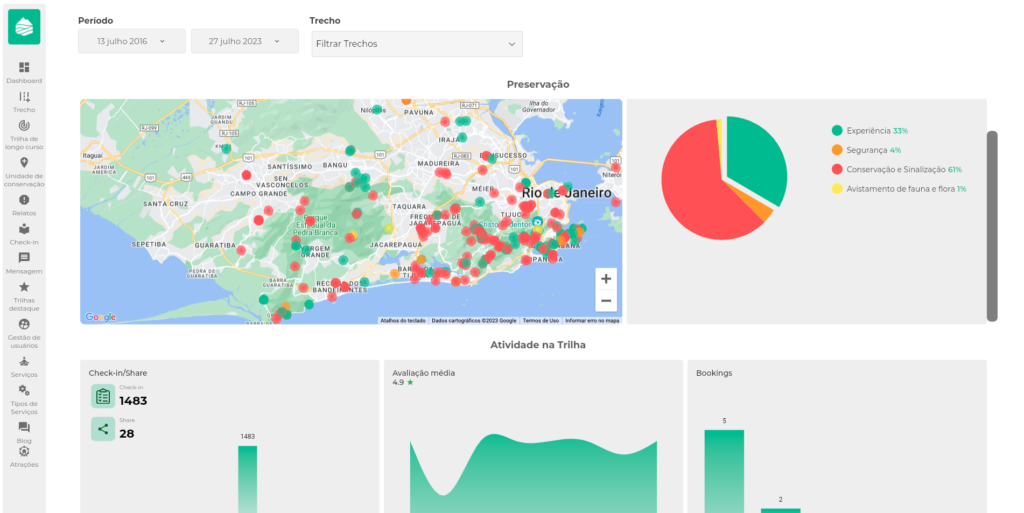
One of the cases developed by Mob is the use of data visualization to demonstrate indicators of social and environmental impact in the practice of sustainable tourism.
Data visualization is a valuable tool that eTrilhas uses to improve its environmental management and educate its customers about sustainability. The company is committed to the development of sustainable tourism and uses data visualization to achieve this goal.
Data visualization can help impact companies in many ways. For example, it can help to:
- Identify opportunities for impact. Data visualization can help impact companies identify areas where they can make a positive impact on the world. For example, an impact company can use data visualization to identify communities that are at risk of vulnerability or poverty.
- Measure the impact. Data visualization can help impact companies measure the impact of their activities. This can be done by tracking data on things like the number of people helped, the amount of resources saved, and the reduction in pollution.
- Communicate the impact. Vidata visualization can help impact companies communicate their impact to stakeholders such as investors, donors and customers. This can be done by creating visual reports such as charts and infographics that illustrate the company's impact.
By using data visualization, impactful companies can make more informed decisions, have a greater impact on the world, and communicate their impact effectively.

Here are some specific examples of how data visualization can be used in impactful companies:
- A renewable energy company can use data visualization to track its solar and wind energy production. This can help the company identify areas where it can improve its efficiency and reduce its carbon footprint.
- A sustainable agriculture company can use data visualization to track its water and fertilizer usage. This can help the company reduce its environmental impact and increase its productivity.
- A social education company can use data visualization to track their students' progress. This can help the company identify students who need additional support and improve the effectiveness of its programs.
Data visualization is a powerful tool that can be used to improve business impact. By using data visualization, impactful companies can make more informed decisions, have a greater impact on the world, and communicate their impact effectively.


